I’ve started using Notion to jot down notes and ideas and turn them into task-lists. It’s been most useful to replace locally-saved OneNote for my Python and Azure study notes, because I go between my work laptop and home PC frequently.
I see a lot of potential with this tool. It loads faster than Google docs, allows image pasting and emoji insertion, is free with no ads, and so far has been mostly intuitive. Because it’s cloud-based I can access my Notion notes from any computer or phone with internet connection. I’m excited to explore how to use it better, to jot down the ideas swirling in my head and turn them into manageable to-do lists and productivity journal. Heck, I want to try Notion for Nest Cafe blog post outlines too!
Akshay Kothari, Notion co-founder, describes this potential well: “We hope that Notion becomes the third generation of productivity software, after Microsoft Office and Google Suite. We’re much more powerful in that people will be able to not just take notes and manage projects, but will be able to create things that work the way their brain works.”
How do you like to use Notion? Feel free to share in the comments any tips, lessons, or templates that have been useful to you.
You delegate tasks to a machine rather than doing it yourself so they can do it automatically. You give them precise instructions, and that is your code.
I love Python, particularly pandas’ rich library for data wrangling and mathematical functions.
But today I encountered a limitation of pandas. And it’s predecessor NumPy came through.
I wanted to calculate the average, median, and count of non-null values in a dataset. My dataset is messy and I need to calculate over different columns that aren’t adjacent to each other. For example, I want the average, median and count of all the values in columns 16 and 20. Not 16 through 20. Not the average of column 16, and the average of 20. One single average for the values in both columns 16 and 20.
This is where the “axis” parameter comes in. It usually defaults to axis = 1, ie df.mean(axis = 1), to indicate we are performing the calculation over a single column. For pd.mean(), I used axis = None to get a single mean over two non-adjacent columns. (double-checked it in Excel!)
import pandas as pd
import numpy as np

# df is the dataframe of my full dataset. Here we'll work with a subset of two columns, rows 4 through 54.
hello = df.iloc[4:55, [16, 20]]

# Get mean of the two columns using pandas.mean
calc1 = hello.mean(axis=None)
But pandas doesn’t have an axis = None option for it’s functions to get the median or counts. It only has axis = 0 (over the row) or axis = 1 (over the column) as options, which is inconsistent with the .mean() option.
So this doesn’t work:
calc2 = hello.quantile(0.5, axis=None)
>>> ValueError: No axis named None for object type DataFrame
But hello NumPy! You do have axis=None available for these functions! So let’s import numpy. My dataset has more than half of NaNs (null values) which I didn’t want to include for the median calculation. So I used np.nanquantile() in order not to count them. The np.quantile() function does count them and was returning a median value of ‘NaN’, which wasn’t what I wanted.
For the count function, we are getting a little creative by first counting all of the non-null values in the hello df (using pd.count()), then summing them up so that we can count across all multiple columns.
Thank you NumPy for saving the day! Although pandas is built on NumPy, I’m glad the libraries’ distinct features are all still accessible and that NumPy hasn’t deprecated.
Now that we have a personal SQL database set up in DataGrip, let’s import our first data table. Note that this is for a personal database set up on a local computer. Not a shared database connected to an online server (which is what most companies or organizations would use).
Here’s how to import a table:
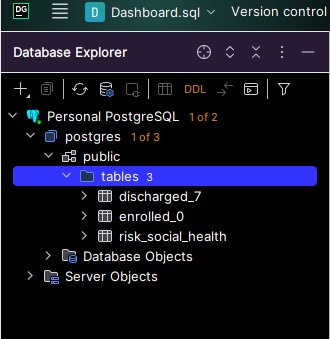
Step 1: Find the “public > tables” folderto which tables will get saved. Starting with a fresh PostgreSQL database set up, this was located in postgres > public > tables. If you do not see a “tables” folder, then use “public”. The tables folder will get automatically created upon importing your first table. Do not use “Database Objects” or “Server Objects”.
Step 2: Right click on “public” or “public > tables” folder > Import/Export > Import Data from File(s).
Step 3: Select the data file to be imported as a table, then ‘OK’. Make sure the file is closed. For example, do not have the .xlsx or .csv open in Excel on your computer, or else you will get an error. Note how many rows of data the original file has (will use for validation in step 5).
Step 4: Set import format settings and set up SQL table. Select the file format (top left corner). Check “First row is header” if it applies (this is not checked by default).Z Set the SQL table name (top right). Review the header names (middle right). Double click on each and rename column names to lowercase with underscores replacing spaces in order to avoid using quotes ” to reference column names in SQL queries. You don’t need to redo this step when importing new data into this table in the future (but you can go back and edit). Click “Import”.
Step 5: Validate that all data rows were imported. A popup will appears in the bottom right corner showing how many rows were imported, and if any, how many errors were written. Check #1: The number of rows imported should match what you expect from the original data file. For example, my data has 64 rows in the original CSV – (1) header row, and (63) data rows. So I expect 63 rows to be imported to the table. If there were any errors, they were not imported into the data table. Investigate, fix, and re-import.
Step 6: Verify that the data looks right. The newly imported table now appears under the “tables” folder on the top left corner. Double click on this to view the table within DataGrip. Check that the data looks correct and as you expect. Issues might include: – Dates are blank or missing values (check that they have the right data type in Step 4, ie Date or Text) – Too many rows: Old data on the table was not deleted, and newly imported data was appended on instead of replacing the old data
As I was trimming lavender and oregano bushes, it occurred to me that I have been intimidated by the field of Data Science because of the word “Science”. What makes Data Science a Science?
In a similar vein, what about “computer science”, “materials science”, “research science”? Is the adoption of the word “science” a far stretch, or is there a thoughtful reason behind this?
In general the field of computer programming languages and data science follows logical thinking and deliberate nomenclature. I don’t know what qualifies as a science (perhaps following a logical procedure such as the scientific method?) but I will find out.
After attending the PyData conference last week I feel much less intimidated by terms like data science, machine learning, data structures, algorithms. In fact, I am hungry to learn more.
I was reading Choose FI: Your Blueprint to Financial Independence and one of the chapters concluded with a question like: “What would you do if you didn’t have to work?”
Something rose to the surface. Even if I didn’t need to work to earn money, I would still practice data analysis using SQL.
This awakened my desire to set up a SQL server-database for personal use. Back-end database access where I can write queries. I miss this dearly from my previous job, where I had an in-house electronic record system and superuser access. I’ve tasted the forbidden fruit and cannot go back to measly front-end, web-browser button clicking to configure reports with limited functionality and flexibility. The power of back-end querying is what I seek, but this is challenging when my company doesn’t currently have a database. Setting one up is notoriously hard, even for professional developers.
I emerged through some struggles to set up a personal SQL database so I can practice queries with my own data. I like the IDE called Datagrip by Jetbrains (free with a student email address) and PostgreSQL (also free) which is what I used in the previous job. Here’s how to set it up.
Step 5: Set up the database in DataGrip. In the “Database” pane on top left, click the + icon > new Data Source > PostgreSQL.
Give it a name. I called it Personal Postgres.
Use localhost, port 5432, and Authentication type as User & Password. Enter the User: Postgres and the Password you defined in step 2. Choose your Save password preference (Forever is convenient for a personal computer).
Test the connection. If it works, then hit Apply and OK.
Note: If you get an error message like this, that means the PostgreSQL was not installed correctly (step 2). You MUST use the username and password. The “No Auth” feature did not work for me.
Step 6: Savor the connection! The database will take a few minutes to connect to an online server so that you can use PostgreSQL SQL functions. If you have very strict firewall settings on your computer, you might need to allow Windows firewall or similar to allow the 5432 port connection.
If everything is good, you’ll get a small Connected status update on the bottom right Event Log:
In a future post, I’ll share how to upload your first database table from a CSV file.
It’s been one year since I started studying programming using Codecademy.com. I set out to study 4 to 5 times a week, every week, 1 lesson page at a time. My longest streak on record is 12 weeks in a row. I’ve completed 86% of the Learn Python 3 course (a hefty course that covers programming fundamentals) and finished the Command Line course too (Linux terminal is not so scary anymore!)
I just finished an online project called ‘Fending the Hacker’ where I read and write to CSV and JSON files programmatically with Python. I didn’t realize this till the end, but this project built on prior lesson topics:
Functions
Loops
Lists
Dictionaries
Modules (JSON, CSV)
Files – Programmatic File Reading/Writing
Looking back on what I’m comfortable with now and how much I’ve learned in one year amazes me. I don’t look back much nor often. But I recall a sinking, confused feeling about not understanding loops, when to use a function, and the purpose of lists and dictionaries. Now I can’t imagine doing any Python analysis or mini project without loops and lists at a minimum. I’m comfortable using them, something distinctly different from before.
This shows me the power of bite-sized but consistent practice. Most lesson topics are divided into about a dozen pages, and I do the reading and practice for 1-2 lesson pages each sitting. That’s 10 minutes or less of light and easy studying. I don’t let long stretches of days pass between each sitting. Recently I’ve shifted my Python study time to earlier in the day to ensure I get it done. I feel the power of compounding knowledge and love it. Is this what the power of compounding interest is also like? The journey along the way has actually been fun.
Onward to the next and final lesson of Python 3, Classes!
The previous post on falsiness (which should be “falseness”, but will continue with the ‘i’ since “Truthiness” is the conceptual term instead of “Truthfulness) has me thinking and steam’s coming out of the engine. I wanted to see for myself these different flavors of False in action, as well as variants of Truthiness.
See the results for yourself running this code in a Python IDE. Experimenting with this made me discover {} is part of the falsiness group, too.
# Values for test: False, 0, None, [], {}

test = []

if test:
    print("True. Condition passed. If statement succeeded.")
else: print("False. Condition did not pass. If statement failed.")
>>> False. Condition did not pass. If statement failed.

test = [1]

if test:
    print("True. Condition passed. If statement succeeded.")
else: print("False. Condition did not pass. If statement failed.")
>>> True. Condition passed. If statement succeeded.
Here’s a lesson on “falseness”- that is, whether values are classified as True or False in Python.
I’m working on a Codecademy project (Abruptly Goblins) where there’s a gamer named Kimberly who is available to play on Monday, Tuesday and Friday. There will be other gamers added in later.
Let’s make a dictionary with name and availability as keys. We’ll also make an empty list called gamers to store valid gamer details.
The project instructions say to: Create a function called add_gamer that takes two parameters: gamer and gamers_list. The function should check that the argument passed to the gamer parameter has both "name" and a "availability" as keys and if so add gamer to gamers_list.
The number of times ‘gamer’ and variants are being tossed around make these instructions confusing as heck! But I plow through. Here’s what I came up with:
def add_gamer(gamer, gamers_list): #gamers_list is the parameter. gamers = [] is what the parameter value will be (argument).
    if gamer.get("name") and gamer.get("availability"): # Access name and avail values if they exist. If any keys not found, returns None.
        gamers_list.append(gamer)
    else: print("Failure, Gamer doesn't have name or availability")
Notice the if statement here. It seems incomplete to me: if gamer.get(“name”) and gamer.get(“availability”):
We will be inserting gamer dictionary arguments. If it doesn’t contain “name” or “availability” as a key, the .get() method will return None (because it did not find the key, and thus has no corresponding value).
But there is something weird assumed here. If the gamer argument does contain keys of “name” and “availability”, the if statement is True, so proceed with the function (appending the player’s details to the gamer list).
1. Why do the two .get() statements result in a True / pass go, collect $200?
2. If any of the .get() statements results in a None, why is that a False / do not pass go, do not collect $200?
The answer to #1 is still unknown to me, but I did find out #2 from Stack Overflow:
The expression x or y evaluates to x if x is true, or y if x is false.
Note that “true” and “false” in the above sentence are talking about “truthiness”, not the fixed values True and False. Something that is “true” makes an if statement succeed; something that’s “false” makes it fail. “false” values include False, None, 0 and [] (an empty list).
When any .get() statements results in a None, that is of the “False” category in Python so it will not proceed. I tested this out by running:
gamers = []

def add_gamer(gamer, gamers_list):
    if gamer.get("name") and gamer.get("availability"):
        gamers_list.append(gamer)
    else: print("Failure, Gamer doesn't have name or availability")

kimberly = {"notname":"Kimberly Chook", "availability": ["Monday", "Tuesday", "Friday"]}
print(kimberly.get("name" and gamer.get("avialability")))

>>> None
So when you ask your partner “Did you clean the bathroom yet?” and get no response for an answer (none, nada, nothing), you can interpret that as: status_bathroom_is_clean = False.
I’ve been gathering data about my hens’ eggs, like how many eggs are laid per day and by whom. One of my baby hens ‘Ramsey’ started laying eggs on March 21st. I weighed the eggs each day and recorded the data. The weight appears to increase gradually over time.
Day
Egg Weight (grams)
0
39
1
42
2
42
3
43
4
47
5
44
6
44
7
43
8
44
9
46
10
50
11
55
I experimented with creating a linear regression (y = mx + b) to find the line of best fit using Python. I plotted the data and could tell this was not linear, so then I constructed a quadratic regression (y = ax^2 + bx + c).
# Set up Quadratic Regression

def calculate_error(a, b, c, point):
  (x_point, y_point) = point
  y = a * x_point**2 + b*x_point + c # Quadratic
  distance = abs(y - y_point)
  return distance

def calculate_all_error(a, b, c, points):
  total_error = 0 # Set initial value before starting loop calculation

  for point in points:
    total_error += calculate_error(a, b, c, point)
  return total_error
I entered the egg weight data as a list (datapoints), and iterated over a range of a, b, and c values to find what combination of a, b, and c would give the smallest error possible (smallest absolute distance between the regression line and actual values). I set initial values of a, b, and c = 0 and smallest_error = infinity and updated (replaced) them each time the error value was smaller than before.
# Ramsey Egg Data
datapoints = [
  (0,39),
  (1,42),
  (2,42),
  (3,43),
  (4,47),
  (5,44),
  (6,44),
  (7,43),
  (8,44),
  (9,46),
  (10,50),
  (11,55)
]

a_list = list(range(80,100))
possible_as = [num * .001 for num in a_list] #your list comprehension here
b_list = list(range(-10,10))
possible_bs = [num * .001 for num in b_list] #your list comprehension here
c_list = list(range(400,440))
possible_cs = [num * .1 for num in c_list] #your list comprehension here

smallest_error = float("inf")
best_a = 0
best_b = 0
best_c = 0

for a in possible_as:
  for b in possible_bs:
    for c in possible_cs:
      loop_error_calc = calculate_all_error(a, b, c, datapoints)
      if loop_error_calc < smallest_error:
        best_a = a
        best_b = b
        best_c = c
        smallest_error = loop_error_calc

print(smallest_error, best_a, best_b, best_c)
print("y = ",best_a,"x^2 + ",best_b,"x + ", best_c)
Ultimately I got the following results:
y = 0.084 x^2 + -0.01 x + 41.7 Which gives a total error of 19.828.
This error feels big to me. I would like to get it as close to 0 as possible, or within single digits. One thing I may do is remove the data point of day 4, 47grams, which was unusually large.
I plotted the data in an Excel graph and added a quadratic regression line as well. The resulting regression line is y = 0.0972x2 – 0.1281x + 41.525. This is close to my Python quadratic regression, but not the same. I’d like to figure out why these differ when the model is similar. It believe this may have to do with formula of error calculation – I am using Total Absolute Error, whereas the more common standard is to get Mean Squared Error.
Note how the data points do not follow linear growth, hence quadratic time!